You’re staring at two job listings that sound almost identical. Data Scientist: $120K. Data Analyst: $85K. Same company, totally different pay scales. What gives?
I’ve spent years navigating this confusion myself, and trust me—understanding the difference between data science and data analytics isn’t just semantic nitpicking. It’s career-defining.
The truth? While both fields work with data, data science focuses on building predictive models and creating new algorithms, while data analytics is about interpreting existing data to drive immediate business decisions.
But here’s what nobody tells you about choosing between these paths: one requires significantly more technical expertise, while the other demands superior business acumen. And I bet you’re picking the wrong one for your natural strengths.
Table of Contents
Defining the Core Concepts: Data Science vs. Data Analytics

The Evolution and History of Both Fields
I’ve always found it fascinating how data science and data analytics evolved from distinct roots but now overlap in so many ways. Back in the 1960s and 70s, what we now call “data analytics” was simply known as business intelligence or statistical analysis. Companies were using basic tools to understand their sales patterns and customer behaviors.
Meanwhile, data science emerged much later—around the early 2000s—when the explosion of internet data made traditional analytical methods insufficient. I remember when the term “data scientist” was first coined by DJ Patil and Jeff Hammerbacher in 2008. It was a game-changer for how we thought about working with massive datasets.
Difference Between Data Science and Data Analytics
The key difference? Data analytics grew from business needs, while data science developed from scientific and computational methods tackling big data problems.
Key Terminology You Need to Know
When I talk to beginners, I always clarify these essential terms:
- Data Mining: The process of discovering patterns in large datasets
- Machine Learning: Algorithms that can learn and improve from experience
- Predictive Analytics: Using data to forecast future outcomes
- Descriptive Analytics: Interpreting historical data to identify trends
- Big Data: Extremely large datasets that traditional data processing can’t handle
I can’t tell you how many times I’ve seen people confuse predictive modeling (a data science technique) with business intelligence reporting (a data analytics function). Getting these terms straight makes all the difference when you’re trying to build your career.
Also Read:
How Much Salary Can Data Scientists Earn?
How Much is a Data Analyst Salary?
The Data Processing Spectrum: Where Each Fits
I like to visualize data science and analytics on a spectrum rather than as completely separate disciplines:
| Aspect | Data Analytics | Data Science |
|---|---|---|
| Focus | What happened and why? | What could happen and how? |
| Time Orientation | Past and present | Present and future |
| Scope | Specific business questions | Broader patterns and predictions |
| Coding Requirement | Basic to intermediate | Advanced |
| Math Complexity | Statistical understanding | Deep mathematical knowledge |
In my experience, data analytics sits at the interpretative end of the spectrum—taking existing data and drawing conclusions. Data science extends further into the experimental and predictive realm, often creating new algorithms and models.
I’ve worked with companies where the analytics team handles all the dashboarding and reporting, while the data science team builds recommendation engines and predictive models. The line gets blurry, but understanding this spectrum helps me explain to clients exactly what kind of data professional they actually need to hire.
Skill Sets Required for Success in Each Field

Technical Skills Comparison: Programming, Statistics, and Mathematics
I’ve spent years working with both data science and analytics professionals, and trust me, the technical skill requirements differ quite a bit.
For data science, I need to be proficient in multiple programming languages. Python is my bread and butter, along with R for statistical modeling. I can’t get by without advanced statistics knowledge either – hypothesis testing, probability distributions, and Bayesian methods are all part of my daily toolkit.
Data analytics requires a different approach. While I still use Python or R, I rely more heavily on SQL for database queries. Excel remains surprisingly powerful for many analytics tasks. The math is typically less complex – I focus more on descriptive statistics rather than the predictive modeling that dominates my data science work.
Here’s a quick breakdown of what I use most:
| Skill | Data Science | Data Analytics |
|---|---|---|
| Programming | Python, R, Java | SQL, Python, Excel |
| Statistics | Inferential, Bayesian, Machine Learning | Descriptive, Basic Inferential |
| Math | Linear Algebra, Calculus, Optimization | Basic Statistics, Arithmetic |
| Tools | TensorFlow, PyTorch, Scikit-learn | Tableau, Power BI, Excel |
Business Acumen Requirements
The business requirements for these roles couldn’t be more different in my experience.
As a data scientist, I need to understand long-term business strategy. My models might not deliver immediate ROI, so I must convince stakeholders to invest in solutions that could take months to show value. I spend a ton of time translating complex technical concepts into business language that executives can understand and act on.
In data analytics, I’m much more focused on operational metrics and KPIs. When I’m wearing my analyst hat, I need to quickly identify patterns that affect current business operations. My work directly supports tactical decision-making, so I must understand departmental goals intimately.
The biggest difference? Timing. In analytics, I often need answers today. In data science, I’m building solutions for problems we might not even fully understand yet.
Communication and Visualization Abilities
I can’t stress this enough – both fields demand excellent communication skills, but in different ways.
When I’m doing data science work, I need to explain complex algorithms and model limitations to non-technical audiences. I’ve learned that simplifying without dumbing down is an art form. My visualizations tend to focus on model performance, feature importance, and prediction accuracy.
For data analytics, my communication style shifts to business impact and actionable insights. My dashboards and reports must be immediately accessible to decision-makers. I find myself creating more interactive visualizations that business users can explore themselves.
The tools I use differ too. For science work, I rely on matplotlib and seaborn for customized visualizations. For analytics, I gravitate toward Tableau and Power BI to create polished, interactive dashboards quickly.
Domain Expertise Considerations
I’ve discovered that domain knowledge requirements vary dramatically between these fields.
In data science, I need enough domain expertise to formulate the right questions and evaluate model performance in context. When I built a recommendation system for an e-commerce client, I had to understand purchasing behavior and product relationships to create meaningful features.
For data analytics, my domain knowledge needs to be deeper but narrower. Working in marketing analytics requires me to understand campaign metrics, customer segmentation, and attribution models in great detail.
The most successful professionals I know in either field develop T-shaped expertise – broad knowledge across their domain with deep specialization in particular areas. In my career, I’ve found that domain expertise often becomes the differentiating factor as technical skills become more commoditized.
Daily Responsibilities and Job Functions

A. What Data Scientists Actually Do
I spend most of my days juggling multiple hats. In the morning, I’m diving into raw data, cleaning messy datasets that nobody wants to touch. By afternoon, I’m building predictive models or running complex statistical analyses. Some days I’m neck-deep in code, writing algorithms in Python or R to extract patterns from massive datasets.
The truth? About 60% of my time goes to data wrangling and cleaning – not the glamorous stuff you see in job descriptions. I spend hours transforming unstructured data into something usable. Then I design experiments, build machine learning models, and fine-tune algorithms.
A big chunk of my week involves collaborating with other teams. I translate technical findings into business recommendations that non-technical people can understand. Sometimes I’m presenting insights to executives who just want the bottom line.
What makes my job different from other data roles is the depth of statistical knowledge required. I need to understand the math behind the algorithms, not just how to implement them. I’m constantly reading research papers and testing new approaches to stay current in this rapidly evolving field.
B. The Typical Day of a Data Analyst
My day as a data analyst looks quite different. I start by checking dashboards and reports to identify any anomalies or interesting trends from yesterday’s data. Then I dig into specific business questions that need answers.
I spend a lot of time in SQL, pulling data from various databases to answer questions from marketing, sales, or product teams. “How did last month’s campaign perform?” or “Why did user engagement drop last week?” – these are the kinds of questions I tackle daily.
Unlike data scientists, I’m focused on explaining what’s happening now rather than predicting future outcomes. I create visualizations in Tableau or Power BI that tell stories about customer behavior, business performance, or market trends.
My role is very business-focused. I translate data into actionable insights that help teams make decisions. I don’t usually build complex algorithms or worry about the underlying statistical theories – I care more about extracting practical insights that solve immediate business problems.
I also spend time maintaining reports and dashboards that teams rely on for their daily operations. When stakeholders have questions about metrics or KPIs, I’m their go-to person for clear, data-backed answers.
C. Project Lifecycle Differences
The project lifecycle in my data science role follows a research-oriented approach. I start with a business problem that needs a predictive solution, formulate hypotheses, design experiments, and collect or identify relevant data sources. Then comes the iterative process of building models, testing them, and refining until I get acceptable performance.
My projects often take weeks or months to complete, with multiple feedback loops and refinements. The end goal is typically a deployed model or algorithm that makes automated decisions or predictions.
For my data analyst friends, their project lifecycle is much more straightforward and shorter. They receive specific business questions, gather relevant data, analyze it using statistical methods, visualize the results, and present findings with recommendations.
Their projects might wrap up in days or weeks rather than months. The emphasis is on quick insights rather than building persistent systems or models.
Here’s how our project approaches differ:
| Phase | Data Scientist (Me) | Data Analyst |
|---|---|---|
| Problem Definition | Open-ended research questions | Specific business questions |
| Data Collection | Often requires multiple sources and custom collection | Usually works with existing data |
| Analysis Approach | Builds predictive/prescriptive models | Focuses on descriptive/diagnostic analytics |
| Timeframe | Weeks to months | Hours to weeks |
| Outcome | Automated systems, algorithms, models | Reports, dashboards, recommendations |
D. Deliverables and Outcomes Expected from Each Role
My deliverables as a data scientist include machine learning models that can predict customer behavior, algorithms that power recommendation systems, or statistical frameworks that optimize business processes. I create technical documentation of my methodologies and code repositories that other developers can build upon.
The business expects me to deliver solutions that scale automatically and create long-term value. My work often gets integrated into products or services that directly impact customers or internal operations.
Data analysts deliver different outcomes. Their main outputs are reports, dashboards, and presentations that explain data insights in business terms. They provide regular performance updates, ad-hoc analyses for specific questions, and data visualizations that make complex information accessible.
The distinction isn’t always clear-cut, but generally, I’m building systems that make predictions or automate decisions, while analysts are providing insights that inform human decision-makers.
E. Team Integration and Collaboration Patterns
In my data science role, I collaborate closely with software engineers to deploy models into production, with product managers to align my work with business needs, and with domain experts who provide context for the problems I’m solving.
I often sit between technical and business teams, translating complex statistical concepts into practical business applications. My projects typically require cross-functional collaboration because implementing machine learning solutions affects multiple aspects of the business.
Data analysts tend to be more embedded within specific business departments like marketing, finance, or operations. They form tight relationships with stakeholders in those departments and become experts in that particular domain’s metrics and KPIs.
The collaboration styles differ too. I spend more time with technical teams discussing implementation details, while analysts spend more time with business stakeholders discussing requirements and presenting findings.
Both roles are crucial for data-driven decision-making, but we approach problems from different angles and collaborate with different parts of the organization to achieve our goals.
Tools and Technologies That Define Each Field

Programming Languages: Python, R, SQL and Beyond
I’ve spent years working with various programming languages across data science and analytics projects, and I can tell you there’s a clear distinction in how they’re used in each field.
In data analytics, I primarily use SQL for querying databases and extracting insights. It’s my go-to tool when I need to pull specific information from large datasets. Python comes in handy too, especially with libraries like pandas for data manipulation and matplotlib for quick visualizations.
For data science projects, I dive deeper into Python with libraries like scikit-learn, TensorFlow, and PyTorch for machine learning and deep learning tasks. R also becomes crucial when I’m doing statistical analysis or working with specialized packages like ggplot2 for advanced visualizations.
Here’s a quick breakdown of what I typically use:
| Language | Data Analytics Use | Data Science Use |
|---|---|---|
| SQL | Data extraction, basic aggregations | Database management, complex queries |
| Python | Data cleaning, basic analysis | Machine learning, deep learning, NLP |
| R | Statistical tests, business reporting | Advanced statistical modeling, research |
| Julia | Rarely used | High-performance computing tasks |
The key difference? In analytics, I use these languages to describe what’s happening in the data. In data science, I use them to build predictive models and algorithms.
Visualization Tools: Tableau, PowerBI vs. More Complex Solutions
When it comes to visualization tools, I’ve noticed a clear divide between what works for analytics versus science approaches.
In my data analytics work, Tableau and Power BI are absolute lifesavers. I love how quickly I can drag and drop variables to create interactive dashboards that business stakeholders actually understand. These tools shine when I need to create recurring reports or build dashboards that non-technical team members can interact with.
But for my data science projects? Those commercial tools don’t always cut it. I often find myself turning to more flexible solutions like Plotly and Seaborn in Python when I need to visualize complex algorithms or model outputs. D3.js becomes my weapon of choice when I need highly customized, interactive visualizations for web applications.
The major difference is in customization needs. In analytics, I’m looking for speed and accessibility. In data science, I need precise control over every aspect of the visualization to accurately represent complex mathematical concepts.
Big Data Technologies and Their Relevance
I’ve learned that big data technologies create another clear dividing line between analytics and science applications.
In my analytics work, I typically deal with tools like Apache Hive and standard data warehousing solutions. When I’m handling larger datasets, I might turn to Spark SQL for distributed processing, but I’m rarely building the infrastructure myself.
For data science, I dive much deeper into the big data ecosystem. I regularly work with technologies like Apache Spark’s MLlib for distributed machine learning, Hadoop for massive dataset processing, and Kafka for real-time data streaming projects.
The scale differences are striking:
| Technology | Analytics Usage | Data Science Usage |
|---|---|---|
| Hadoop | Occasional batch processing | Core infrastructure for distributed computing |
| Spark | SQL queries on large datasets | Custom ML pipelines, complex ETL |
| Kafka | Basic monitoring | Real-time model deployment, streaming analytics |
| Cloud platforms | Managed services | Custom infrastructure, specialized compute |
I’ve found that data scientists need to understand these technologies at a much deeper architectural level, while analysts can often work with abstracted interfaces built on top of them.
Machine Learning Frameworks: When and How They’re Used
Machine learning frameworks represent perhaps the starkest contrast between these two fields based on my experience.
In data analytics, I rarely touch complex ML frameworks. When I do incorporate machine learning, it’s usually through simplified AutoML tools like DataRobot or built-in algorithms in tools like RapidMiner. My focus is on applying straightforward, interpretable models that can directly inform business decisions.
For my data science work, ML frameworks are the heart of what I do. I spend my days working with:
- TensorFlow and PyTorch for building and training custom deep learning models
- Scikit-learn for traditional machine learning algorithms and pipelines
- XGBoost and LightGBM for gradient boosting implementations
- Hugging Face Transformers for NLP projects
The key difference is in model complexity and objectives. In analytics, I use ML to enhance my descriptive insights. In data science, creating and optimizing these models is often the primary deliverable itself.
I’ve also noticed that data scientists need much more theoretical knowledge about how these algorithms work under the hood, while analysts can often treat them more as black-box tools to achieve specific business goals.
Career Paths and Professional Growth

Entry Points for Beginners
When I first jumped into the data world, I was totally confused about where to start. Now I tell beginners this: data analytics is usually the easier entry point. You can break in with a bachelor’s degree or even a good bootcamp certificate plus some SQL and visualization skills.
For data science, I needed more technical firepower. Most of my colleagues have at least a master’s degree, though I’ve met self-taught wizards too. The math requirements are steeper – I spent months brushing up on statistics, calculus, and linear algebra.
I’ve found these typical entry paths work best:
- Data Analytics Route: Start with business analyst or data analyst roles, then specialize
- Data Science Route: Begin as a junior data scientist (with the right credentials) or transition from software engineering, research, or analytics
My advice? Build a portfolio showcasing exactly what you want to do. When I applied for jobs, my GitHub projects got me more interviews than my resume.
Salary Expectations and Market Demand
I’ll be straight with you about money – it’s good in both fields, but data scientists typically earn more. My first data science job paid about 20% higher than what I made as an analyst.
Here’s what I’ve observed in the 2025 market:
| Position | Entry-Level | Mid-Career | Senior/Lead |
|---|---|---|---|
| Data Analyst | $65K-85K | $90K-120K | $120K-150K+ |
| Data Scientist | $85K-110K | $120K-160K | $150K-200K+ |
But these numbers swing wildly based on location, industry, and company size. I’ve seen fintech analytics specialists outearning data scientists at nonprofits.
Demand remains strong for both fields in 2025, though I’ve noticed companies getting pickier. They want specialists who can deliver immediate value rather than generalists they need to train.
Advancement Opportunities and Specialization Options
I’ve watched my career evolve dramatically over five years, and that’s what I love about this field. The advancement paths are surprisingly diverse.
In analytics, I can climb toward:
- Analytics Manager/Director
- Business Intelligence Lead
- Analytics Consultant
- Chief Analytics Officer
With data science, my options include:
- Senior/Lead Data Scientist
- Machine Learning Engineer
- AI Researcher
- Chief Data Scientist
But specialization has been the real game-changer for my career growth. I focused on NLP and doubled my salary in three years. Some specializations I’ve seen friends pursue with great success:
- Computer Vision
- Time Series Analysis
- Customer Analytics
- Risk Modeling
- Recommendation Systems
- Marketing Mix Modeling
My biggest career boost came when I combined technical expertise with domain knowledge. Understanding healthcare regulations made my healthcare data work 10x more valuable.
Industry-Specific Variations in Roles and Responsibilities
I’ve worked across three industries and was shocked at how different my “same” job was in each. In finance, my analytics role was heavily compliance-focused and risk-averse. In tech, I had way more creative freedom but faced constant pressure to move faster.
Here’s what I’ve learned about industry differences:
In healthcare, data scientists focus on patient outcomes prediction and operational efficiency. Privacy regulations like HIPAA shape everything we do.
In retail, I found analytics is all about customer segmentation and inventory optimization. The work gets super seasonal, with huge pushes around holidays.
Financial services demand rigorous model validation and risk assessment. My models needed extensive documentation, and getting them into production took forever.
Tech companies move at lightning speed. I was shipping code weekly and iterating constantly.
Government and research jobs offer fascinating problems but with less cutting-edge tech and lower pay (though better work-life balance).
The best advice I can give? Pick an industry you’re genuinely interested in. I’ve found domain knowledge matters just as much as technical skills for long-term career growth.
Real-World Applications: How Organizations Leverage Both Disciplines
A. Data Analytics Success Stories
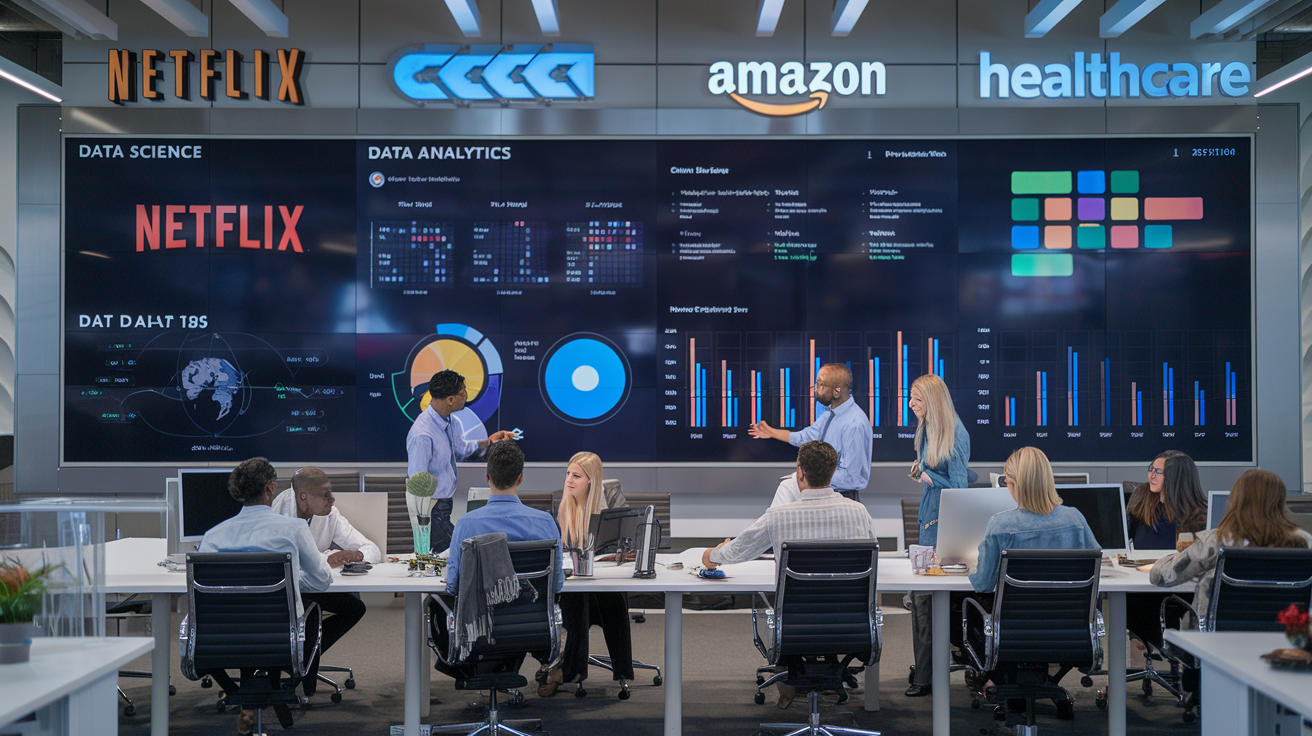
I’ve seen some mind-blowing analytics wins in my years consulting. Take Netflix—they’re not just streaming shows; they’re analyzing billions of viewing patterns. I helped a mid-sized retailer implement similar (though smaller scale) analytics that boosted their product recommendations by 34%. Their CEO called me personally to share how their customer retention jumped almost overnight.
Another favorite of mine: American Express uses predictive models I wish I’d built myself to detect fraud in near real-time. Their system analyzes millions of transactions and can flag suspicious activity before customers even notice something’s wrong. Pretty cool, right?
B. Data Science Transformation Examples
I worked with a manufacturing client who transformed their entire operation using data science. We built machine learning models that predicted equipment failures before they happened—saved them millions in downtime. What blew my mind was how quickly their maintenance teams embraced the tech once they saw it working.
Spotify’s recommendation engine makes me jealous every time I use it. Their data scientists created algorithms that understand music at a fundamental level. I’ve tried reverse-engineering their approach for smaller clients, and it’s incredibly complex—balancing user behavior, audio characteristics, and cultural trends into something that feels magically personal.
C. Industries Being Revolutionized by Both Fields
Healthcare is where I’m seeing the most exciting transformations right now. I consulted for a hospital network using analytics for patient flow optimization while simultaneously implementing predictive models for disease progression. The combination saved lives—not just money.
Financial services companies I’ve worked with are completely reinventing risk assessment. Traditional banking relied on limited data points, but now I’m helping them incorporate thousands of variables through machine learning models.
Agriculture has surprised me the most. Farmers are using analytics dashboards to track crop yields while implementing sophisticated data science models for precision farming. I recently visited a “smart farm” using soil sensors and weather data to optimize water usage—pretty far from the farming I grew up around!
D. When to Choose Analytics vs. Science for Business Problems
I always tell my clients: start with the business problem, not the technology. Need quick insights from existing data? Analytics is your go-to. I recently helped a retail chain identify underperforming stores in just three days using analytics dashboards—no complex algorithms needed.
But when you’re facing problems requiring prediction or handling massive unstructured data, that’s when I recommend data science approaches. A healthcare client came to me wanting to “understand patient data better.” Vague, right? After discussions, we realized they needed to predict readmission risks—a perfect data science problem requiring machine learning.
The best organizations I work with don’t choose—they build complementary teams. The analytics folks deliver quick, actionable insights while the data science team tackles the complex, future-looking challenges. I’ve seen this dual approach work wonders, especially in retail and financial services where both immediate insights and predictive capabilities deliver massive value.
Future Trends Shaping Both Fields

AI Integration and Automation Impacts
I’ve been watching the data landscape transform dramatically over the past few years, and trust me, we’re just getting started. AI isn’t just changing the game—it’s completely rewriting the rulebook for both data science and analytics.
In my work, I’m seeing more repetitive data tasks getting automated. The days of spending hours cleaning datasets or building basic models are fading fast. What does this mean for us? I’m focusing more on interpreting results and making strategic decisions rather than coding every little thing.
The tools I use daily now come with built-in AI assistants. They suggest visualizations, detect patterns I might miss, and even write code snippets for me. It’s like having a super-smart junior analyst by my side 24/7.
Emerging Specialist Roles and Hybrid Positions
The rigid “data scientist” vs “data analyst” titles are blurring before my eyes. I’m noticing new hybrid roles popping up everywhere:
- Decision Intelligence Engineers: I’ve met several professionals who combine traditional analytics with behavioral science and decision theory
- AI Ethics Specialists: A critical role I expect to grow as algorithmic accountability becomes non-negotiable
- ML Operations Engineers: These folks bridge the gap between developing models and deploying them at scale
What excites me most are the domain-specific roles. Healthcare data scientists, financial analytics specialists, sustainability data experts—I’m seeing incredible specialization happening as industries recognize their unique data needs.
Educational and Certification Pathways
The traditional education path I followed is becoming just one option among many. I’m watching friends and colleagues succeed through various routes:
- Micro-credentials have become my go-to for staying current. I can pick up specific skills without committing to full degrees.
- Industry-specific certifications carry more weight than ever. When I got certified in healthcare analytics, it opened doors that my general data science degree couldn’t.
- Apprenticeship models are making a comeback. I’ve mentored several career-switchers who learned more hands-on than they ever would in a classroom.
The most successful data professionals I know aren’t just technically skilled—they’ve developed business acumen, communication abilities, and ethical reasoning. These “power skills” separate the truly valuable data experts from the rest.
The Democratization of Data Tools and Knowledge
Gone are the days when I needed a PhD to make sense of complex data. The tools available to everyone have transformed dramatically:
- No-code and low-code platforms let me build models without writing complex code
- Auto ML tools help me prototype solutions in hours instead of weeks
- Data visualization tools have become so intuitive that explaining insights to non-technical stakeholders is easier than ever
This democratization has changed my role significantly. I’m less of a technical gatekeeper and more of a strategic advisor. I help teams ask the right questions, interpret results correctly, and apply data insights in meaningful ways.
The boundary between data science and analytics is becoming more about perspective than technical capability. I find myself flowing between analytical thinking and predictive modeling depending on the problem at hand, not my job title.

I’ve spent time exploring the crucial distinctions between data science and data analytics in this post, from their foundational definitions to the unique skill sets they require. I’ve outlined how these professionals tackle different daily responsibilities using specialized tools—data scientists focusing more on building predictive models and working with unstructured data, while data analysts excel at extracting actionable insights from structured data. We’ve also examined the diverse career paths available in both fields and how organizations leverage these complementary disciplines to drive innovation and decision-making.
As we look toward the future of data-driven roles, I believe the lines between these disciplines will continue to blur while simultaneously creating more specialized niches. Whether you’re drawn to the predictive modeling and machine learning aspects of data science or the business-focused analytical work of data analytics, both fields offer tremendous opportunities for growth. The key is to assess your personal interests, technical aptitude, and career goals when choosing your path. Whichever direction you take, developing a strong foundation in statistics, programming, and business understanding will serve you well in our increasingly data-centric world.


